Uncertainty displays for on the go decision making
Everyday apps give you one confident number you are asked to make a decision on. Numeric predictions like how long it will take to commute, what temprature it will be and when a bus might arrive are numeric point estimates which obfusicate uncertainty
- Role
- Development + Mixed-methods researcher
- Venue
- ACM CHI 2018
- Recognition
- Honourable Mention for best paper (top 5%)
- Google Scholar Citations
- 242
High-level description
This was the second part of an NIH grant-funded research program into how people make decisions under uncertainty in everyday transit. I worked with a rockstar team of research assistants and professors to design, implement and evaluate a range of uncertainty encodings — eventually presenting the paper at CHI 2018, where it received an Honourable Mention for Best Paper.
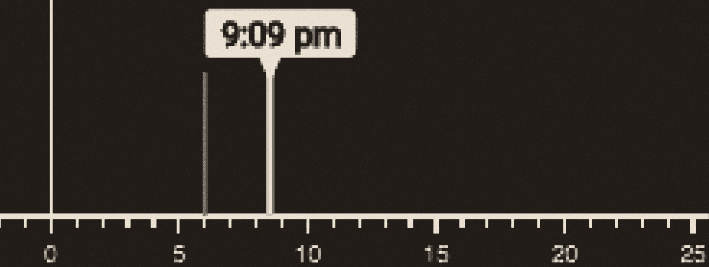
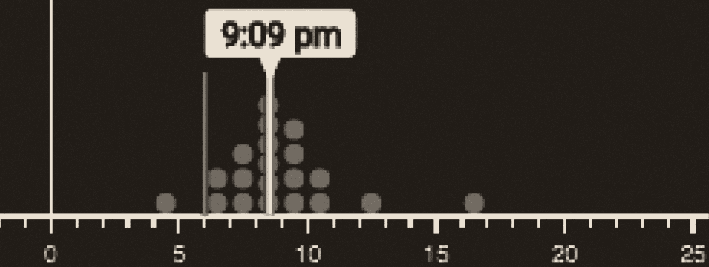
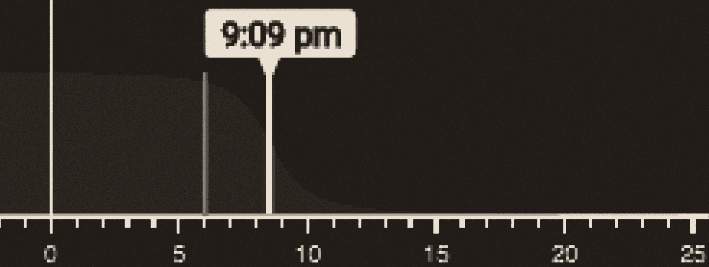
- Quantile dot plots and cumulative distribution functions (CDFs) were the most effective displays for conveying uncertainty to users.
- Even users unfamiliar with mathematical representations made better decisions when some form of uncertainty was shown.
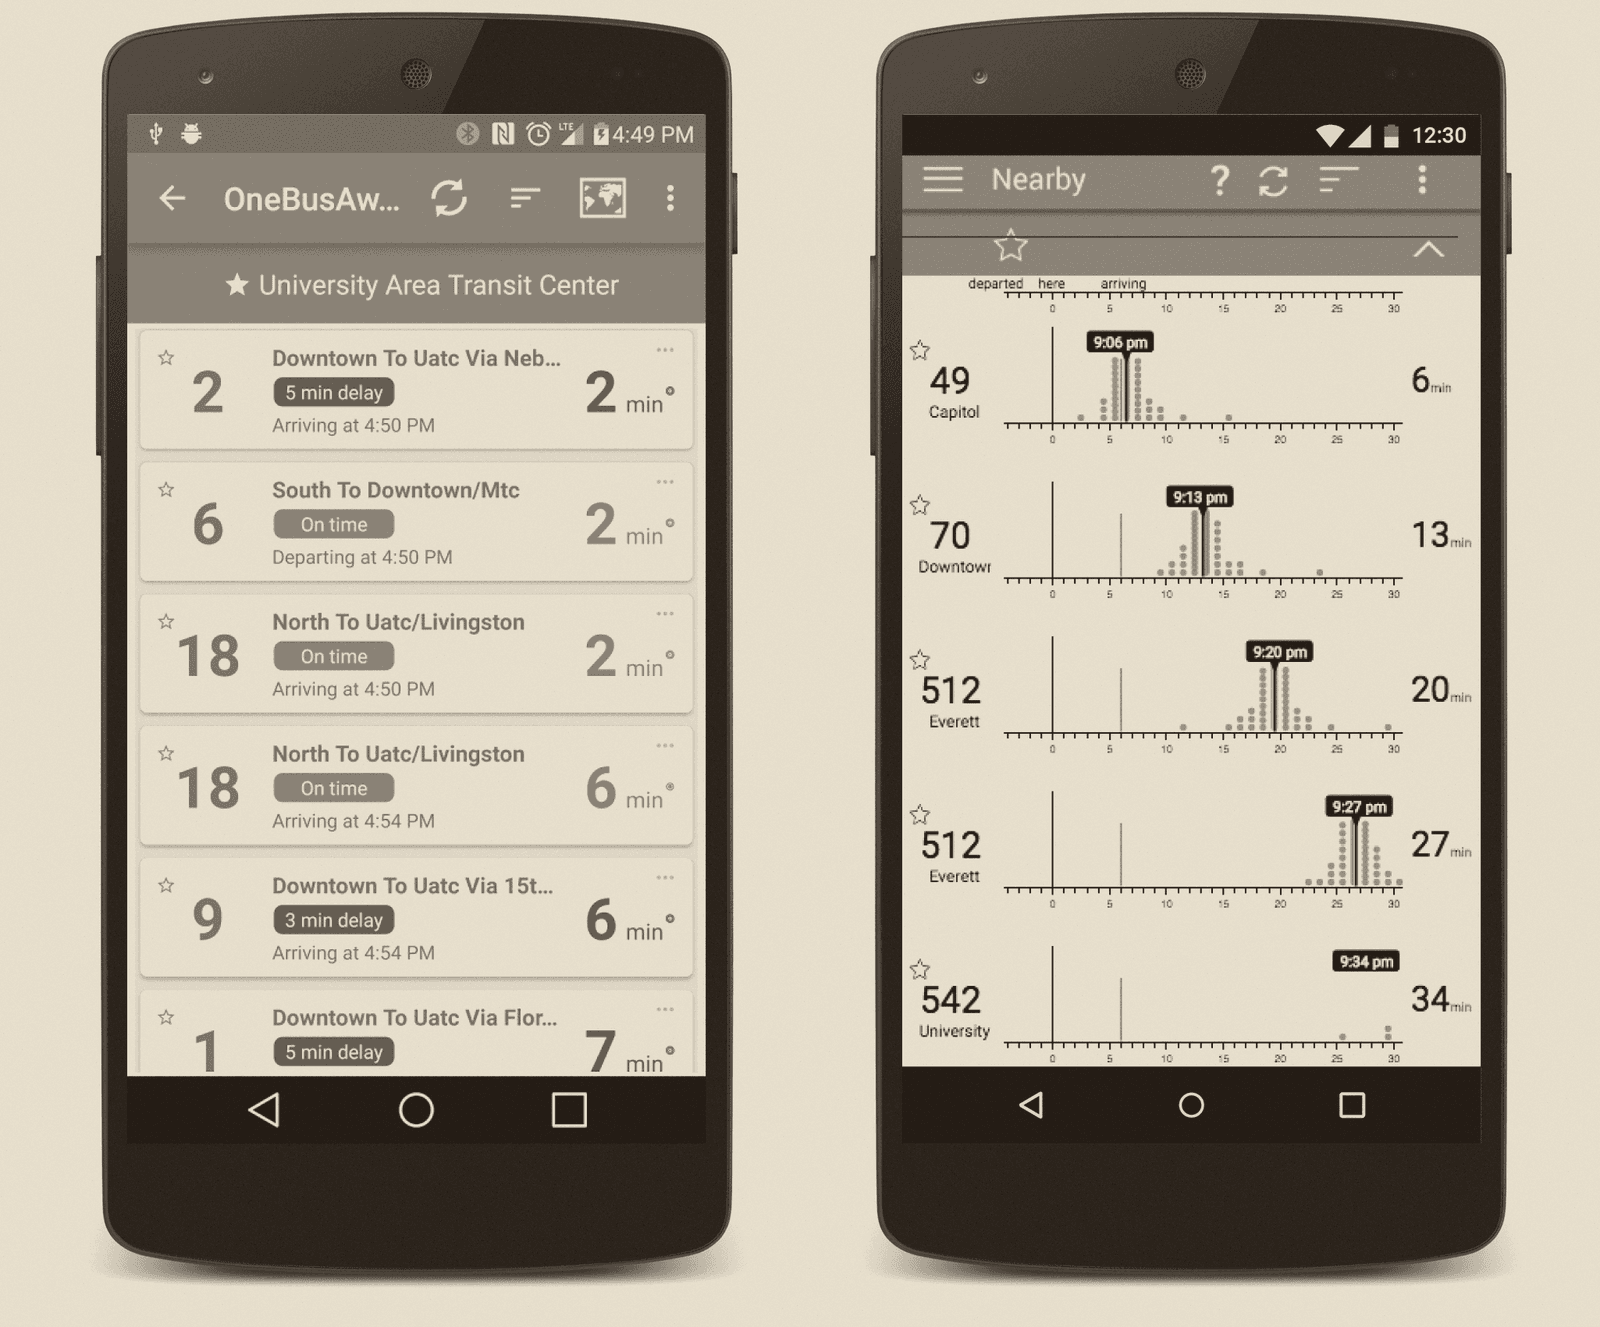
We tested 8 different uncertainty displays at scale.
408 people made real, incentivized bus-catching decisions. People were rewarded for good calls, penalized for waiting in the rain. Of ten ways to show uncertainty, quantile dot plots and CDFs produced the best, most consistent decisions: about 97% of the best-possible payoff, and steadily better as people learned to read them.